| StockFetcher Forums · Filter Exchange · PORTFOLIO SELECTION AND MANAGEMENT USING RISK/REWARD RATIOS | << 1 ... 59 60 61 62 63 ... 65 >>Post Follow-up |
| Kevin_in_GA 4,599 posts msg #124485 - Ignore Kevin_in_GA |
7/22/2015 9:49:09 PM Toad: not really sure how you are backtesting this - I simply use the end of each month and make a re-allocation at the open of the next trading day. Here are the StrataSearch backtest results for the same period as you have backtested: EQUITY CURVE: 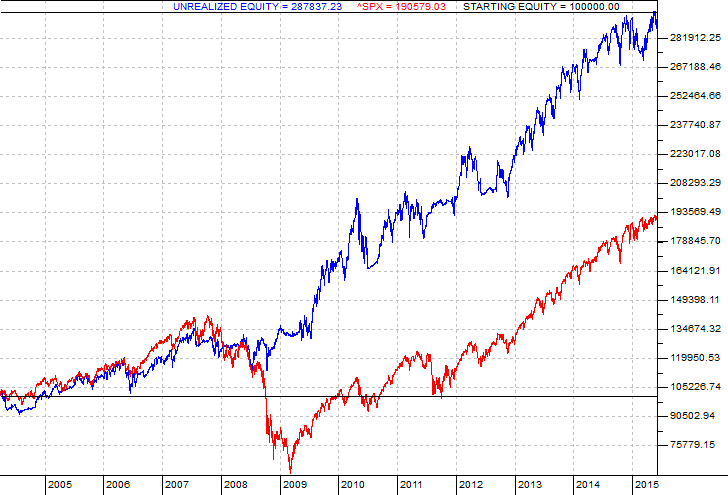
STATS: 
The more simplistic SPY-AGG system gives basically the same results: EQUITY CURVE: 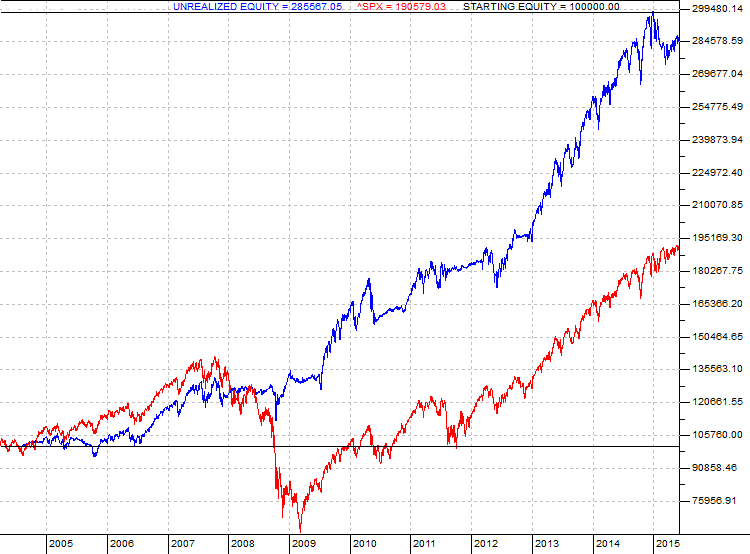
STATS: 
This is consistent with what I have been seeing - it beats the market with lower drawdown and consequently a higher Sharpe ratio. Trade it or not as you see fit. |
| Toad 20 posts msg #124487 - Ignore Toad |
7/23/2015 12:02:03 AM It is probably me trying to over-complicate my spreadsheet...I will look into my sheet this weekend. Thanks for providing me with the stratasearch graph for the period I used...should be helpful to find where I am going wrong. |
| mahkoh 1,065 posts msg #124488 - Ignore mahkoh |
7/23/2015 6:54:44 AM Toad, One thing that seriously affects your results is using non adjusted close prices. You should check the results when using adjusted prices as Stratasearch does. |
| Toad 20 posts msg #124489 - Ignore Toad |
7/23/2015 8:33:56 AM I will look at that mahkoh, thanks. I have been using non-adjusted close prices, but can swich them for the adjusted easily. I would imagine that does make a difference especially with AGG. |
| mahkoh 1,065 posts msg #124496 - Ignore mahkoh |
7/23/2015 5:38:41 PM Examining the equity curves above I notice that holding SPY actually outperforms the system until mid 2007. And note that buy and hold nearly doubles after touching breakeven in late 2011 while rotating adds some 50 % during the same period. It would seem the system mainly has an edge during times of market turmoil. |
| Kevin_in_GA 4,599 posts msg #124500 - Ignore Kevin_in_GA |
7/23/2015 10:07:53 PM Mahkoh - basically you are correct, but it really has to do with avoiding large drawdowns. The system may not beat SPY every year, but it seems to beat it over a longer timeframe, which is why this is an INVESTMENT strategy rather than a trading strategy. |
| Toad 20 posts msg #124503 - Ignore Toad modified |
7/23/2015 11:59:13 PM Just a quick follow up. After changing my sheet for adjusted closing data, I believe my analysis is more closely matching Kevin's. So Mahkoh and Kevin please accept some virtual cookies as gratitude for helping me find my error and giving me the means to check my analysis. One question I have about the StrataSearch though is: Is the equity curve that is being generated an averaged equity curve for all the runs in the Monte Carlo analysis? I imagine it is...not sure what it would be otherwise. I ask because the overall gain is close to what I am getting for the average of all possibilities with my analysis....in which case I think we are in agreement. I will develop somewhat "bastardized" equity curves (only updating on the month not day) and post them tomorrow or Saturday to illustrate my concerns with the technique. It does look a little better than my initial impression of it though. Edit: Kevin -- Is it possible to export the equity curve as a .csv or some other text format so I can import it into excel. This would be the easiest way to compare I think. I will send you a virtual cake if you can do that :P. |
| mahkoh 1,065 posts msg #124506 - Ignore mahkoh |
7/24/2015 5:52:22 AM Market turmoil equals large drawdowns, I guess we all can agree to that. Still, looking at Toad's file (good job there, btw) it seems rather peculiar that there is such a large deviation in returns upon choice of reallocation date. |
| Toad 20 posts msg #124524 - Ignore Toad modified |
7/24/2015 9:44:43 PM I have updated the spreadsheet for the adjusted close values. The optimization study ended up on the same results (ideal for SPY-IWM-EFA-AGG is 3 month look back, ideal for SPY-AGG is 70% 6 month, 30% 3 month). The updated spreadsheet can be obtained here: http://www.mediafire.com/view/gr3j8hyd14vg3mk/Kevin%27s_Mutual_Funds_Screener_Validation_-_Updated.xlsx The revised results are as follows for the SPY-IWM-EFA-AGG: - The optimal look back to use is the 3 month and nothing else - The average account balance of the 21 possible reallocation days was 272% - The standard deviation was 63% - The max balance was 438% - The min balance was 203% - The lowest period (21 day) return was -33% - The highest period (21 day) return was 17% A graph illustrating my concern with the method is below: 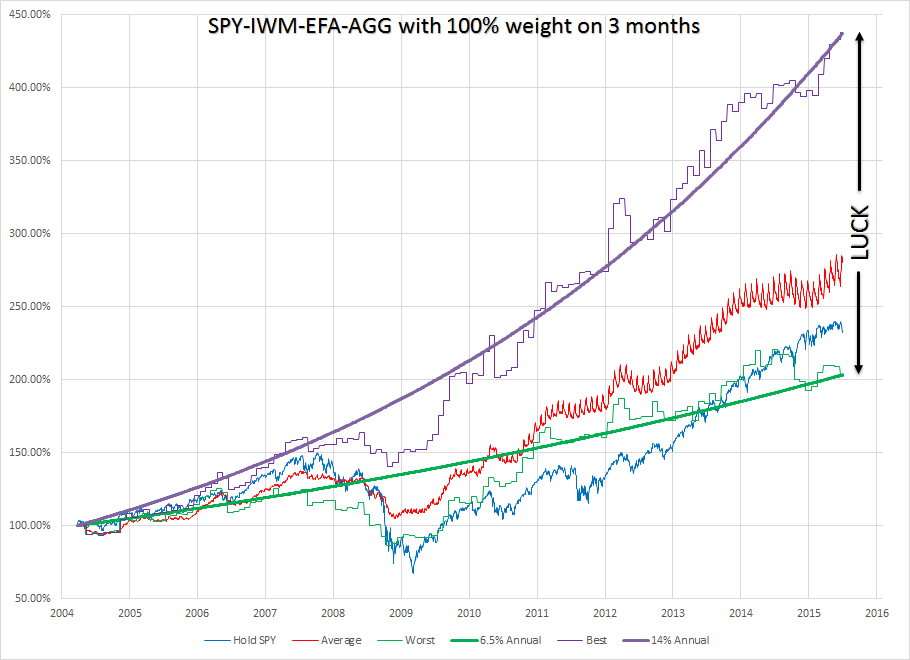
From this graph you can see that the annual return varies between 6.5% and 14% depending on the day you select to reallocate funds. At worst you end up basically following SPYÖsimilar drawdowns, similar gains. Over a period of 11 years, the luck can make a substantial difference to your account. Comparing my graph to Kevinís, you can see that my ďaverageĒ curve is the same as his equity curve. Mine has some fuzz in it since I was only picking up the on the month values, not the individual day values and I didnít try to smooth the curve out any after averaging. The revised results are as follows for the SPY-AGG: - The optimal look back to use is 70% 6 months, 30% 3 months - The average account balance of the 21 possible reallocation days was 263% - The standard deviation was 39% - The max balance was 363% - The min balance was 217% - The lowest period (21 day) return was -16% - The highest period (21 day) return was 14% A graph of this one showing the same problem, but to a lesser degree, is below: 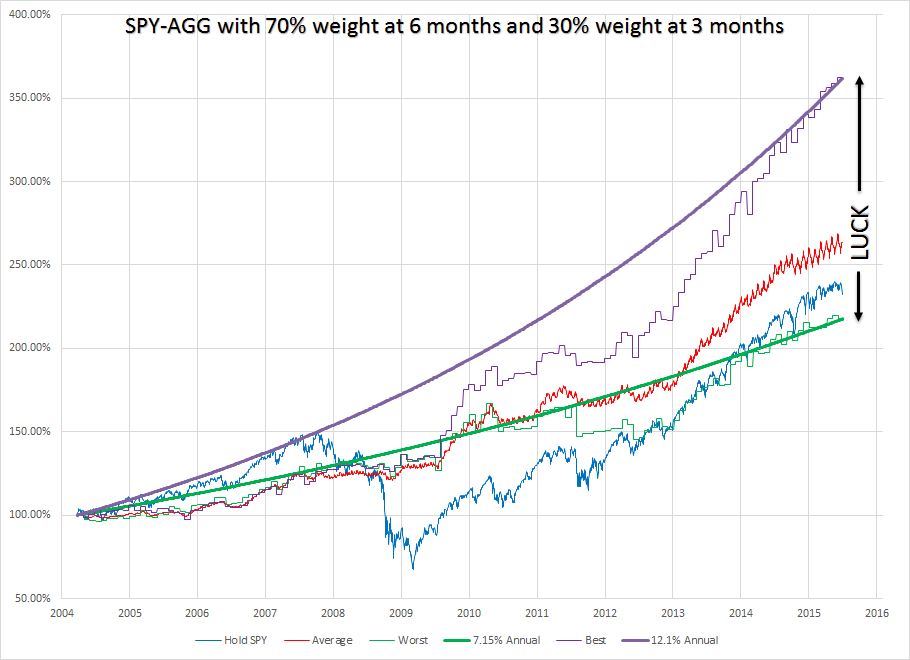
From this graph you can see the annual return varies from 7.15% to 12.1% depending on the day you select to reallocate funds. Again, at worst you end up similar to SPY. The difference is, that this one seems to always avoid the large drawdowns. To me it is not surprising that this one has less variance since it only uses 2 funds instead of 4. Comparing my graph to Kevinís you can see that my average curve is slightly lower than his equity curve. I believe this is because we were optimizing for different conditions. I sought to maximize the minimum (the green jagged line) with the thought that this would give me the highest possible returns with the lowest standard deviation (amount of luck). This resulted in the 70% 6 month, 30% 3 month. Kevin sought to maximize the average which results in 100% 6 months. Which system is better? The SPY-IWM-EFA-AGG or the SPY-AGG? I donít know. Since this is a long term strategy, it seems either way you go the worst you will do is follow SPY. The SPY-IWM-EFA-AGG system has more upside potential but you have to be able to stomach the larger drawdowns. Is there statistical significance to reallocating funds this way? Maybe, but there isnít as much as I expected. Iím still on the fence about using this myself although I certainly havenít come up with anything better. Also, as a comparison using the adjusted close values: - Hold SPY 3-26-04 to 6-1-15 --> 238% balance (shown on graphs) - Hold IWM 3-26-04 to 6-1-15 --> 252% balance - Hold EFA 3-26-04 to 6-1-15 --> 194% balance - Hold AGG 3-26-04 to 6-1-15 --> 158% balance Feel free to go into my spreadsheet and dissect itÖtry to find an error somewhere. At this point I would be very surprised if there is, but I still hope there is. I will not be revisiting it myself in search of errors anymore, but if someone sees something, let me know and I will look into it. |
| mahkoh 1,065 posts msg #124530 - Ignore mahkoh |
7/25/2015 5:16:08 PM Just a thought: Maybe window dressing by hedge funds every quarter has an influence? |
| StockFetcher Forums · Filter Exchange · PORTFOLIO SELECTION AND MANAGEMENT USING RISK/REWARD RATIOS | << 1 ... 59 60 61 62 63 ... 65 >>Post Follow-up |